Curveline OLAP Analysis
Financial analysis refers to an assessment of the viability, stability and profitability of a business, sub-business or project.
First of all, a business must already have appropriate management reports to quickly identify areas requiring management attention.
Once these issues are identified, it will be necessary to ?drill-down?into operational aspects that need fixing. There are various
reasons that lower-level management and employees may not be capable or willing to identify and fix problems. Therefore a neutral
finance-based analysis will help identify the problems and their sources, as well as point to ways of improving the problems.
Curveline Planning cash flow statement will reveal where the company's resources have come from and how they have been applied during
the year.Ratio analysis is an important tool for understanding and comparing business performance. However, ratios and other financial
calculations are rarely useful when looked at in isolation. it is important to carry out calculations of ratios and other significant
financial figures with previous years (many companies publish five or ten year summaries as part of their annual reports) in order to
identify positive or adverse trends). Comparison with other, relevant competitors and industry "norms" is also important.
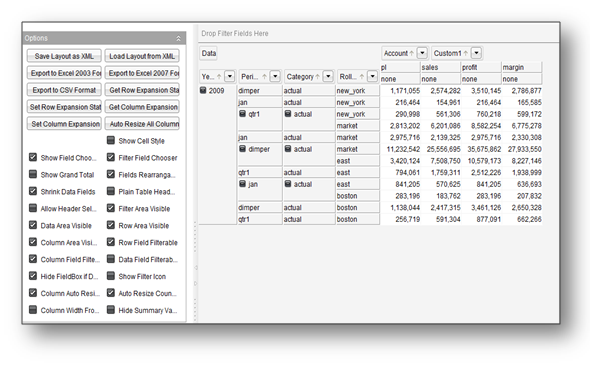
During drilldown, users can instantly pivot financial information online to work through what-if and what-happened scenarios, rather than
writing several custom reports. With the ease of drag and drop a graphical user interface (GUI) capability that lets you perform operations
by moving the cursor. For example, using pivot analysis functionality column headers and row headers can be interchanged and more detailed
drill down is possible with the simple mouse cursor operation. Users can sort accounting dimensions such as charts of accounts, periods,
rollup, versions within a multidimensional view to quickly reorganize summary and detail financial information. Alternatively, users can
compare figures across multiple business units, departments, or product lines to pinpoint a specific piece of information.
The versatility of the Analysis functionality increases productivity by enabling information users to quickly detect trends and exceptions
in their financial data and simultaneously expand the organization's knowledge of the relationships between components of financial information.
Click for price details
Click to contact for more details
Click for brochure
|