Curveline Analytic Server
Curveline cube is a data structure that allows fast analysis of data. It can also be defined
as the capability of manipulating and analyzing data from multiple perspectives. The arrangement of data into cubes overcomes
a limitation of relational databases. Relational databases are not well suited for near instantaneous analysis and display of
large amounts of data. Instead, they are better suited for creating records from a series of transactions
known as OLTP or On-Line Transaction Processing. Although many report-writing tools exist for relational databases, these
are slow when the whole database must be summarized.
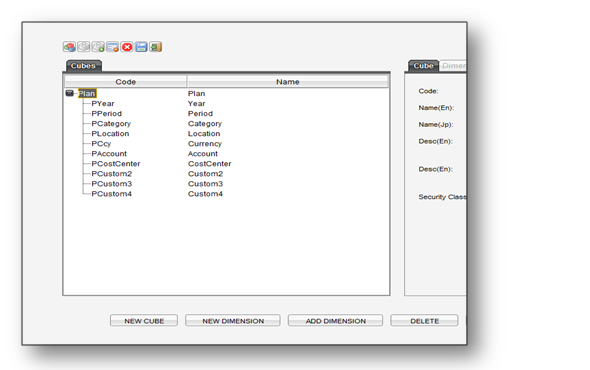
The Curveline cube consists of numeric facts called measures which are categorized by dimensions. Measures are derived from the records in
the fact table and dimensions are derived from the dimension tables.
Features:
♦ Managing multiple cubes and dimensions
♦ Powerful engine with inbuilt translation, elimination and consolidation
♦ Drill down and OLAP analysis
♦ Year-end roll forward management
♦ Manage dashboard and reports
♦ Manage data loading
♦ Manage version control
♦ Manage workflow
♦ Manage security
♦ In-memory calculation engine
A financial analyst might want to view or "pivot" the data in various ways, such as displaying all the cities down the page
and all the products across a page. This could be for a specified period, version and type of expenditure. Having seen the
data in this particular way the analyst might then immediately wish to view it in another way. The cube could effectively
be re-oriented so that the data displayed now has periods across the page and type of cost down the page. Because this
re-orientation involves re-summarizing very large amounts of data, this new view of the data has to be generated efficiently
to avoid wasting the analyst's time, i.e. within seconds, rather than the hours a relational database and conventional
report-writer might have taken.
The analyst can understand the meaning contained in the databases using multi-dimensional analysis. By aligning the data content
with the analyst's mental model, the chances of confusion and erroneous interpretations are reduced. The analyst can navigate
through the database and screen for a particular subset of the data, changing the data's orientations and defining analytical
calculations.The user-initiated process of navigating by calling for page displays interactively, through the specification of
slices via rotations and drill down/up is sometimes called "slice and dice". Common operations include slice and dice,
drill down, roll up, and pivot.
Click for price details
Click to contact for more details
Click for brochure
|